
- Oksana Kondratova
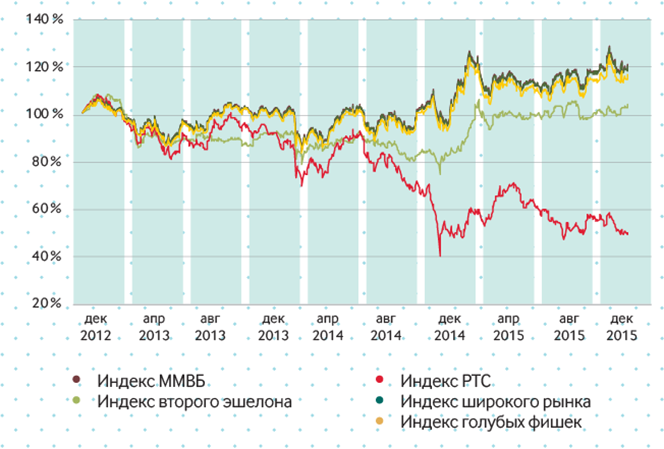
"The main indices of Moscow Exchange — MICEX Index and RTS Index — are calculated based on the performance of the 50 most-liquid shares of Russian issuers and serve as the key indicators of the Russian stock market"
PART 3. INCLUSION ON INDICES AND EXPANSION OF INVESTOR BASE. INCLUSION OF RUSSIAN SHARES ON FOREIGN INDICES
Chapter 1. Moscow Exchange Indices
1. General information
A stock market index is an important macroeconomic indicator that assesses a securities market and its movements, and analyses and forecasts market conditions. It generically measures the value of a certain group of securities (index basket) and offers insight into overall market conditions even when certain share prices exhibit mixed trends. Its movements in time are more important than its ultimate value.
An index is the yardstick, or benchmark, to assess the performance of investment decisions. It also serves as a basic asset for forward contracts. End investors often want a return on investment comparable with overall stock exchange growth. Therefore, index funds are based on passive management strategies, i.e. the asset structure of such funds is aligned with the composition of the index basket.
Index products are instruments which attract investors that aim to reduce the management-related costs of transactions and major entities, such as pension funds, which try to minimise non-systemic risk.
The total resources currently managed by funds using Moscow Exchange indices as their benchmark total over USD5 billion. In Russia, there are numerous investment funds based on Moscow Exchange indices. Among the largest are the asset management companies of Bank of Moscow, Raiffeisen-Capital, and TKB BNP Paribas Investment Partners. The largest foreign clients are Nomura Asset Management, Credit Suisse, BNP Paribas, Royal Bank of Scotland, and Societe General.
The interest of investment funds and institutional investors to securities traded on Moscow Exchange indices boosts the long-term demand for the shares of Russian issuers and enhances liquidity.
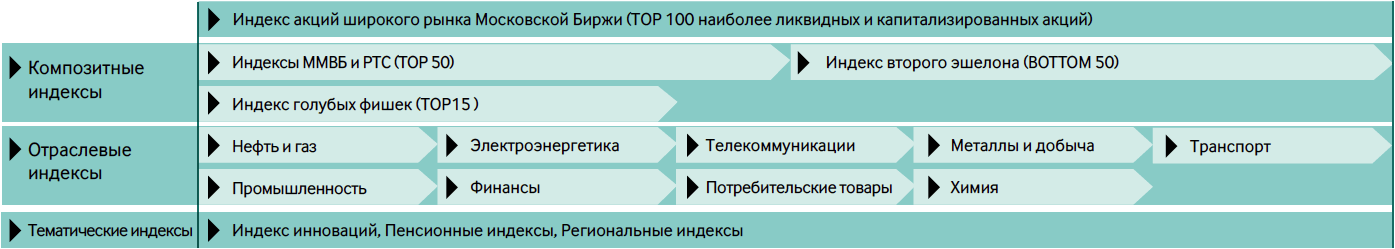
2. Moscow Exchange Equity index family
The main indices of Moscow Exchange — the MICEX Index and the RTS Index — are computed based on the performance of the 50 most-liquid stocks of major Russian issuers included in the single index basket. They are recognised benchmarks of the Russian securities market.
Each of the main indices has its own unique history. The MICEX index has been computed since 1997 based on rouble share prices. Initially, the list of the index basket did not include a fixed number of shares and the index could include all shares traded on the exchange. Stock market development and the listing of a larger number of companies prompted the need to limit the number of stocks for index calculation to 30.
The RTS Index began its history even earlier ? its first values were published in 1995. Unlike the MICEX Index, it is denominated in US dollars and has 50 stocks in the constituent list.
The RTS Index began its history even earlier ? its first values were published in 1995. Unlike the MICEX Index, it is denominated in US dollars and has 50 stocks in the constituent list.
As part of the programme to create a single family of indices, an updated methodology for the main Moscow Exchange indices was put in place on 4 March 2013 to integrate the two oldest indicators. The main features of the methodology included the calculation of the MICEX Index and RTS Index based on a single basket of securities, a uniform calculation formula, the historical continuity of the values of both indices, a similar index publication rate of one second and the source price. These changes resulted in a clear-cut hierarchy of indices and a transparent calculation formula, which is clear to investors and makes index replication easier, in a comprehensible division of indices denominated in roubles and other currencies. The MICEX Index continues to be calculated in roubles on the basis of trade prices set in roubles, while the RTS Index is calculated on the prices of the same trades but denominated in US dollars.
The next step towards the unified Moscow Exchange Index family was the introduction of the common calculation methodology on 24 February 2016. This methodology incorporates all major indices such as the MICEX Index, RTS Index, Broad Market Index, Second-Tier Index, Blue-Chip Index, Sectoral Indices and MICEX Innovation Index. The Exchange also improved the accuracy of U.S. dollar-denominated indices through the conversion of the total market capitalization of constituents instead of prices thereof, from roubles into U.S. dollars.
It is impossible to build a perfect index that meets the requirements of all market participants. Different consumer groups determine demand for various indices. Therefore, Moscow Exchange calculates several indices to express the market from different perspectives in order to create diverse products.
Main characteristics of Moscow Exchange indices
| Index | Currency | Number of constituents | Weight of largest constituent, % | Annualized returns of the end of 2015, % | Free float-adjusted total market cap, RUB bln | Coverage of availble market cap,% | |||
|---|---|---|---|---|---|---|---|---|---|
| 1 YR | 3 YRS | 5 YRS | max. | min. | |||||
| MICEX Index | RUB | 50 | 15% (five issuers - 55%) | 26,12 | 17,11 | 19,44 | 1482,00 | 9,46 | 84,97 |
| RTS Index | USD | -4,26 | -47,53 | -50,42 | |||||
| Blue Chips Index | RUB | 16 | 20% | 25,15 | 14,36 | 15,2 | 1482,00 | 72,75 | 66,61 |
| Second Tier Index | RUB/USD | 50 | 15% | 25,58 | 12,96 | 3,21 | 10,86 | 0,31 | 2,88 |
| Broad Market Index | 100 | 15% | 26,03 | 16,97 | 18,93 | 1482,00 | 0,31 | 87,85 | |
| Sectoral Indices | от 4 до 25 | 15%, 25% or 100% | from 9,43 to 75,96 | from -37,16 to 110,72 | from -44,68 to 73,86 | from 9,41 to 1482 | from 0,31 to 3,41 | from 0,4 to 42,42 | |
Chart 2. Profile of Moscow Exchange indices as of January 2012% 2
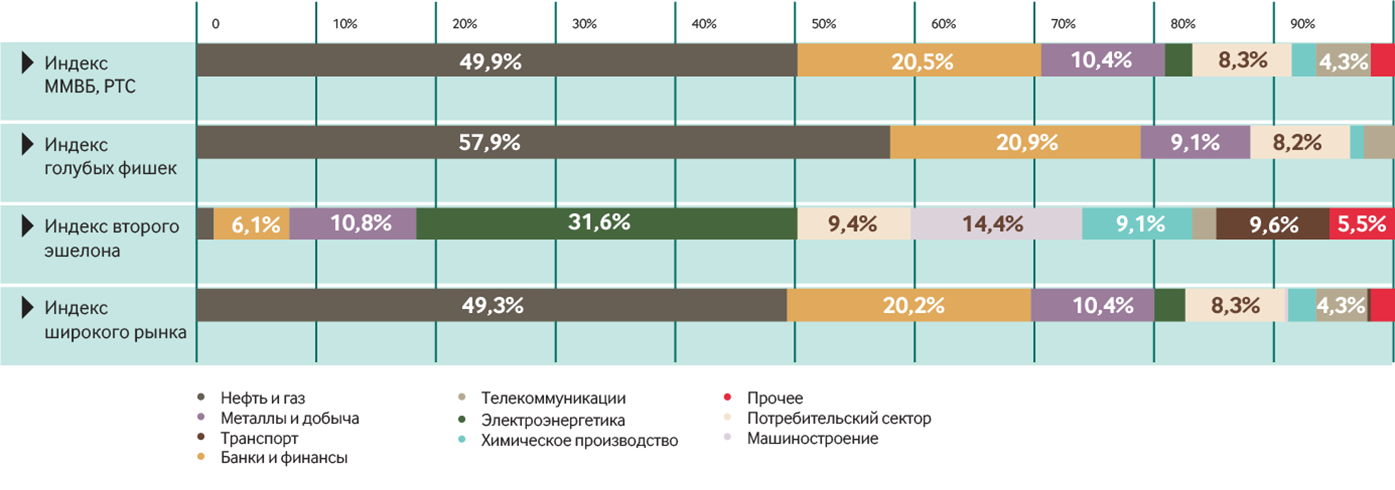
Sectoral index baskets are also formed on the basis of 100 shares of the Broad Market Index by dividing its constituents into industries. Such indices help stock market participants choose which industries are more attractive. At present, Moscow Exchange рcalculates sectoral indices based on nine major sectors of the Russian economy: 1) oil and gas, 2) power utilities, 3) telecommunications, 4) metals and mining, 5) engineering, 6) banking and finance, 7) consumer goods and retailers, 8) chemicals, and 9) transport.
На долю акций, входящих в состав индексов, приходится около 85% от Shares included on the indices account for about 85% of the Russian market"s total capitalisation. The oil and gas sector has a heavy weighting on the MICEX Index and the RTS Index — about 50%. There is a significant share of financial companies (over 20%), as well as metals and mining, consumer sectors and telecommunications (8% each).
The Moscow Exchange equity indices are calculated in two currencies — the Russian rouble and US dollar.
Moscow Exchange also calculates some thematic indices — indicators of certain market segments outside the main line of indices: the alternative MICEX10 Blue Chip Index, built on an equal weights principle, as well as the MICEX Innovation Index, regional indices and indices of pension market assets (capitalisation indices).
To build a more consistent market picture, Moscow Exchange calculates its indices only on the basis of shares outstanding. In order to determine that, a free float correction factor is calculated based on information disclosed by the issuers and the peer review of Index Committee members.
Chart 3. Sectoral structure of Moscow Exchange indices
In order to determine the free float, government, municipal bonds and those of legal entities or individuals, if they exceed 5%, as well treasury stock and investment fund securities, if they exceed 25%, must be subtracted from the total number of shares. Thus, the free float excludes holders from the category of strategic investors.
If the index includes securities with a significant imbalance between capitalisation and liquidity, they may negatively affect its value. Therefore, following the Moscow Exchange peer review of market conditions, the value of the free-float factor may be limited for shares included on the index for the first time which exhibit such an imbalance.
In order to limit the extent of the impact some issuers may have on equity indices, there is a requirement that the total weighted capitalisation of each issuer"s securities should be within a certain parameter (15–25% depending on the index). This requirement is set by applying factors that limit the weight of some securities within the indices.
In calculating the MICEX Index, the RTS Index and some other indices of the family, it is important to meet the Bank of Russia requirements for indices which may be used as a basis for setting up mutual funds. These requirements are related to those issuers, whose securities are included on the index, to the diversification of the index basket, to share capitalisation and liquidity within the index and to information disclosure.
The MICEX Index and the RTS Index meet the requirements of the US market regulator – CFTC, as well as the directives of the European Parliament and the EU ? UCITS, on the diversification of the index calculation base, indicator adequacy to the market and accessibility.
3. Principles of stock selection for indices
The Moscow Exchange indices may include shares and depositary receipts admitted to trading on the Exchange. Index calculation bases are regularly revised — once every three months. The selection of securities for the index basket requires statistical data analysis from trading results over the previous three months.
The Broad Market Index provides the basis for all index lists and includes the top 100 securities based on liquidity, capitalisation and free float.
The algorithm for this index is based on a two-stage ranking — by liquidity and free-float adjusted capitalisation:
- Stage I includes the selection of securities from the list of shares admitted to trading. The selected securities are those whose free float is at least 5% and where the number of days for closing one trade amounts to at least 70% of the total number of trading days in the previous three months.
- The top 120 shares of those that meet the Stage I criteria are selected based on the median day-trading volume over the previous three months.
- Of the shares that meet all the terms, another 100 shares are selected based on free float and adjusted median capitalisation over the previous three months.
A security that starts to meet index inclusion requirements for the first time is initially listed among candidates for inclusion and may be eligible for index inclusion if it continues to meet such criteria during subsequent revisions of the index calculation base, i.e. in another three months.
A fast track procedure for index inclusion is provided for post-IPO shares. Such shares may be immediately included in indices in the event that they meet all criteria.
If a share no longer meets the index criteria, it is included in the watchlist. If during the subsequent calculation base revision such shares still fail to meet the criteria, they are excluded from the indices.
Securities may also be extraordinarily excluded from the list of index calculation if they are removed from the list of securities admitted to trading or, for instance, due to the onset of a corporate event in the issuer"s company such as reorganisation, merger, share split or consolidation. In the case of other corporate events like a share split or consolidation, index-related ratios are recalculated at the end of the trading day.
The calculation base for the MICEX Index and RTS Index includes the top-50 shares in terms of the free-float-adjusted capitalisation from the Broad Market Index calculation base. The index inclusion also considers the use of the "buffer zone" principle: to be included in the main index a stock must be ranked not lower than 45th in the free-float-adjusted capitalisation rating.
Other shares from the Broad Index calculation base, which are not included in the MICEX and RTS Indices, make the list of the Second-Tier Index. If The Broad Market Index includes at least three companies of a certain economic sector, the shares of these companies serve as a calculation base for their Sectoral Index.
Securities for the Blue Chip Index fall under more stringent selection requirements. This index basket includes shares of the top-15 ranked issuers selected in terms of free-float-adjusted capitalisation. They should also meet the given criteria.
The Index Committee of Moscow Exchange exercises overall control and makes proposals to amend the index calculation methodologies. The Committee is comprised of analysts from leading Russian brokerages. It also makes recommendations for changes to the calculation bases of Moscow Exchange indices and for assessment of correction factors.
Chapter 2. Inclusion of Russian Shares on International Indices
1. Major indices that include securities of Russian companies
In addition to the indices of Moscow Exchange there are other bourses which also have shares of Russian companies in their baskets — foreign exchanges are also interested in Russian issuers. Leading index agencies calculate a series of various indicators showing stock market trends in developed and emerging economies. They also include the Russian securities market. Such indicators aim to compare the profitability of assets of different countries and to attract global players to new markets.
Derivatives Trading Volumes for Indices in Contracts, 6 months 5
| Exchange | Q2 2015 |
|---|---|
| National Stock Exchange India | 5,987,531,814 |
| EUREX | 2,281,865,702 |
| CME Group | 1,931,874,612 |
| Korea Exchange | 1,465,965,240 |
| Chicago Board Options Exchange | 1,130,706,835 |
| China Financial Futures Exchange | 1,001,206,064 |
| Japan Exchange Group | 966,927,276 |
| TAIFEX | 677,593,572 |
| Moscow Exchange | 583,506,960 |
| BSE India | 484,692,068 |
| Singapore Exchange | 473,260,461 |
| BM&FBOVESPA | 301,021,213 |
| Osaka SE | 296,905,761 |
| Hong Kong Exchanges | 262,596,233 |
2. S&P Dow Jones Indices
S&P Dow Jones Indices is an integrated company that calculates about 130,000 exchange indices. The oldest of them is Dow Jones Industrial Average, whose values date from 1896. It also calculates the most marketable US indicator —S&P 500.
In the large family of indices there is also an index that includes securities of Russian companies — S&P BMI Russia. The calculation of this index started in 2008. To be included in the index securities should meet the criteria for free-float-adjusted market capitalisation. The number of instruments in S&P BMI Russia fluctuates. As of 31 December 2013, the index calculation base included 81 stocks
To improve index basket diversification and limit the impact of larger companies, the index established a cap on the maximum weighting of issuers. The weighting of one company should not exceed 20%, and the total weighting of companies covering more than 5% should not exceed 45%. Such stringent requirements for the proportions of securities within indices are based on the regulatory norms of foreign legislation. Index conformity with regulatory requirements increases demand from private (retail) investors and heightens the interest of financial institutions that create index financial products (foundations, including ETFs, debt instruments, derivatives, especially futures, options, certificates, etc.).
Aside from S&P BMI Russia, the company calculates indices which include securities not only of Russian companies but also of BRIC countries (S&P BRIC) and all other emerging markets (S&P EMERGING).
3. FTSE Indices
Since 2006, FTSE Group and London Stock Exchange (LSE) have calculated the index of Russian securities — FTSE Russia IOB Index. The index basket includes the 15 most-liquid and capitalised stocks of Russian companies circulated on LSE as depositary receipts or ordinary shares. This is a price index weighted in terms of free-float-adjusted market capitalisation. The index is calculated based on USD prices — in real time, as well as prices set in EUR and GBP — once a day.
Securities within the index should meet certain liquidity criteria: average trading volume for the day should be at least USD200 million. To ensure the stability of the index basket, the buffer zone principle is applied, which allows companies ranked in terms of free-float-adjusted market capitalisation to be eligible if they rank above twelfth or removed if ranked below nineteenth. To limit the impact of larger companies on the index, the index sets a cap on one weighted instrument — no more than 15%.
FTSE Group calculates both the price index of Russian shares and the full profitability index, which besides price changes also includes dividend payouts. Apart from the index reflecting the price changes of only Russian companies, the FTSE Group calculates indices showing the trends of the emerging market group, including Russia. Among them are the BRIC Index (FTSE BRIC 50) and the overall index of emerging markets (FTSE Emerging EMEA 40).
4. Market Vectors Indices
Van Eck Global specialises in investment management, offering not only ETF-and ETP-products, but also calculating indices branded as Market Vectors.
Since 2010, the agency has calculated the index of Russian shares – the Market Vectors Russia Index. This is a price index weighted by free-float-adjusted capitalisation. The calculation base for the index may include 30 to 50 shares and depositary receipts traded both on Moscow Exchange and on foreign trading floors. The prices of different bourses denominated in various currencies are recalculated into USD at single exchange rates.
Currently, one of the oldest EFT products ? MV Russia ETF, which has been traded at NYSE Arca since 2007, looks at the trends of this index. Before 2010, this fund replicated DAXglobal Russia+ Index.
"Designed to represent equity markets around the world, MSCI Market Cap Weighted Indexes are used by thousands of asset managers, pension funds, hedge funds and banks as benchmarks for over USD9 trillion of assets."
Chapter 3. MSCI GLOBAL EQUITY INDICES
1. Introduction
MSCI has been at the forefront of index construction and maintenance for over 40 years, launching its first global equity indexes in 1969. Globalisation and the rapid integration of markets have led MSCI to explore alternative approaches to categorizing the global equity universe and product development. MSCI has remained a market leader by expanding and enhancing its index offering to reflect the evolving and complex needs of the institutional investment community with ground breaking new products, innovative research, high quality data and dedicated client support.
MSCI"s objective is to construct and maintain its global equity indices in such a way that they may contribute to the international investment process by serving as:
- Relevant and accurate performance benchmarks;
- The basis for asset allocation and portfolio construction across geographic markets; size?segments, style segments, and sectors
- Effective research tools;
- The basis for investment vehicles.
Developments in international equity markets and investment management processes have led many investors to desire very broad coverage and size?segmentation of the international equity markets. To address these desires and continue to meet our index construction and maintenance objective, after a thorough consultation with members of the international investment community, MSCI enhanced its Standard Index methodology, by moving from a sampled multi?cap approach to an approach targeting exhaustive coverage with non?overlapping size and style segments. The MSCI Standard and MSCI Small Cap Indices, along with the other MSCI equity indices based on them, transitioned to the Global Investable Market Indices (GIMI) methodology described in the GIMI methodology book. The transition was completed at the end of May 2008.Together, the relevant MSCI Large Cap, Mid Cap and Small Cap Indices make up the MSCI Investable Market Index for each country, composite, sector, and style index that MSCI offers.
2. MSCI Indexes: Overview
Over $9 trillion in assets are benchmarked to MSCI indexes 1
| Funds | Funds assets | ||
|---|---|---|---|
| Active management | Passive management | Total | |
| Institutional | 5,070,056 | 1,157,531 | 6,227,587 |
| Retail | 2,303,777 | 107,892 | 2,411,669 |
| ETF | 373,302 | 373,302 | |
| Total | 7,373,833 | 1,638,725 | 9,012,559 |
| Assets benchmarked to some notable MSCI index categories | |
|---|---|
| ACWI | USD 2.0T |
| EAFE | USD 1.8T |
| EM | USD 1.5T |
| World | USD 2.2T |
| US | USD 208.5B |
| Europe | USD 459.2B |
| Asia | USD 309.4B |
Today, MSCI offers a family of over 160,000 consistent and comparable indexes which are used by investors around the world to develop and benchmark their global equity portfolios. MSCI indexes are also licensed as the basis for financial products such as exchange traded funds and structured products.
Around 600 ETFs from many of the world"s leading ETF providers including BMO Asset Management, ETF Securities, FinEx Capital, Harvest Global Investments, iShares, Lyxor, Mirae Global Asset Investments, SSgA and UBS are based on MSCI indexes.
Exchanges around the world have chosen MSCI equity indexes as the basis for numerous listed derivatives. These include: Chicago Mercantile Exchange, NYSE Liffe, London Liffe, Johannesburg Stock Exchange, Singapore Stock Exchange and Eurex.
3. MSCI Global Investable Market Indices
The MSCI indices based on GIMI methodology aim to provide:
- Coverage of the relevant investable opportunity set with non-overlapping size and style segmentation;
- A strong emphasis on investability and replicability of the indices through the use of size and liquidity screens;
- Size segmentation that aims to balance the objectives of global size integrity and country diversification;
- A balance between index stability and a timely reflection of changes in the opportunity set;
- A complete and consistent index family, with Standard, Large Cap, Mid Cap, Small Cap, and Investable Market Indices.
4. Index construction
The GIMI index construction process involves:
- defining the equity universe;
- determining the market investable equity universe for each market;
- determining market capitalisation size segments for each market;
- applying final size-segment investability requirements;
- applying index continuity rules for the Standard Index (Large Cap + Mid Cap).
1. Defining the Equity Universe.
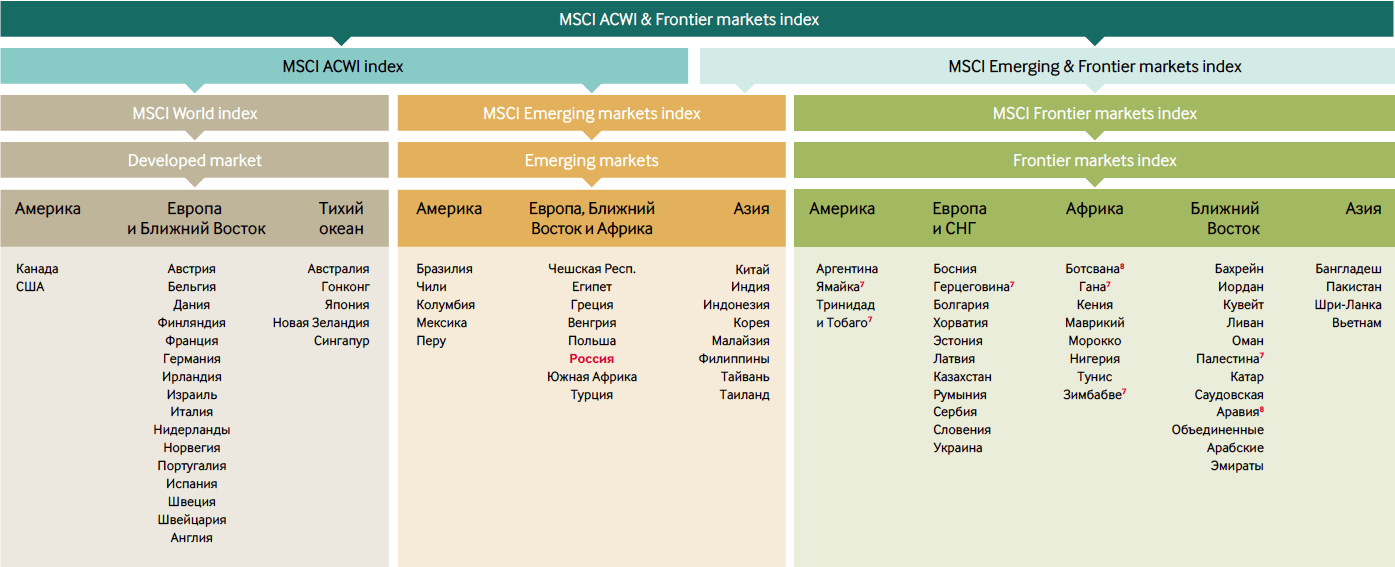
MSCI begins with securities listed in countries included in the MSCI Global Investable Market Indices. Of these countries, currently 21 are classified as developed markets and 34 as emerging markets. All listed equity securities and listed securities that exhibit characteristics of equity securities, except mutual funds, ETFs, equity derivatives, limited partnerships and most investment trusts, are eligible for inclusion in the equity universe. Real estate investment trusts in some countries and certain income trusts in Canada are also eligible for inclusion. Each company and its securities are classified in only one country.
2. Determining the Market Investable Equity Universe for Each Market.
The equity universe in any market is derived by applying investability screens to individual companies and securities in the equity universe of that market. Some investability requirements are applied at the individual security level and some at the overall company level, represented by the aggregation of individual securities of the company. As a result, the inclusion or exclusion of one security does not imply the automatic inclusion or exclusion of other securities of the same company.
3. Determining Market Capitalization Size-Segments for Each Market.
In each market, MSCI creates an Investable Market Index, Standard Index, Large Cap Index, Mid Cap Index and Small Cap Index. The Standard Index is the aggregation of the Large Cap Index and the Mid Cap Index. The Investable Market Index is the aggregation of the Standard Index and the Small Cap Index. In order to create size components that can be meaningfully aggregated into composites, individual market size segments balance the following two objectives:
- Achieving global size integrity by ensuring that companies of comparable and relevant sizes are included in a given size segment across all markets in a composite index.
- Achieving consistent market coverage by ensuring that each market"s size segment is represented in its proportional weight in the composite universe.
4. Applying Final Size-Segment Investability Requirements.
In order to enhance the replicability of Size-Segment Indices, additional size-segment investability requirements are set for the Investable Market and the Standard Indices. These investability requirements include minimum free float market capitalization, minimum liquidity and minimum foreign room.
5. Applying Index Continuity Rules for the Standard Index.
In order to achieve index continuity, as well as provide some basic level of diversification within a market index, notwithstanding the effect of other index construction rules, a minimum number of five constituents will be maintained for a developed market Standard Index and a minimum number of three constituents will be maintained for an emerging market Standard Index.
Weighting All indices under the GIMI methodology are free-float weighted, i.e., companies are included in the indices at the value of their free public float, as measured by the Foreign Inclusion Factor multiplied by security price. In cases where other foreign investment restrictions exist that materially limit the ability of international investors to freely invest in a particular equity market, sector or security; a Limited Investability Factor (LIF) may also be applied to the free float to insure that the investability objectives of the indices can be achieved.
Free Float / Foreign Inclusion Factor MSCI defines the free float of a security as the proportion of shares outstanding that are deemed to be available for purchase in the public equity markets by international investors. A constituent"s Foreign Inclusion Factor (FIF) is equal to its estimated free float rounded-up to the closest 5% for constituents with free float equal to or exceeding 15%. For example, a constituent security with a free float of 23.2% will be included in the index at 25% of its market capitalization. For securities with a free float of less than 15%, the estimated free float is adjusted to the nearest 1%.
Regional Weights. Market capitalization weighting, combined with a consistent target of 99% of free float-adjusted market capitalization, aims to ensure that each country's weight in regional and international composite indices approximates its weight in the total universe of developing and emerging markets. A market is equivalent to a single country except for Europe, where all markets are aggregated into one single market for index construction purposes. Individual country indices of the European developed markets are derived from the constituents of the MSCI GIMI Europe Index.
Prices The prices used to calculate the MSCI indices are the official exchange closing prices or those figures accepted as such. MSCI reserves the right to use an alternative pricing source on any given day.
Foreign Exchange Rates. MSCI currently uses the WM/Reuters Closing Spot Rates, taken at 4:00 p.m., London time. MSCI may monitor exchange rates independently and may, under exceptional circumstances, elect to use an alternative exchange rate if the WM Reuters rate is believed not to be representative for a given currency on a particular day.
5. Index maintenance
MSCI indices are maintained with the objective of reflecting, on a timely basis, the evolution of the underlying equity markets. In maintaining the MSCI indices, emphasis is also placed on continuity, replicability and minimizing index turnover. Among other things, maintaining the MSCI indices involves making: additions to and deletions from the indices, changes in number of shares, and changes in FIFs as a result of updated free float estimates. Index maintenance can be described by three broad categories of implementation of changes:
1. Semi-Annual Index Reviews (SAIRs). The objective of the SAIRs is to systematically reassess the various dimensions of the Equity Universe for all markets on a fixed semi-annual timetable. An SAIR involves a comprehensive review of the Size Segment and Global Value and Growth Indices. During each SAIR, the Equity Universe is updated and the Global Minimum Size Range is recalculated for each size segment. Then, the following index maintenance activities are undertaken for each market:
- Pedating the Market Investable Equity Universe;
- Reassessing the Segment Number of Companies and the Market Size-Segment Cutoffs;
- Assigning companies to the size segments taking into account buffer zones;
- Assessing conformity with Final Size-Segment Investability Requirements.
2. Quarterly Index Reviews (QIRs).QIRs are designed to ensure that the indices continue to be an accurate reflection of the evolving equity marketplace. This is achieved by a timely reflection of significant market driven changes that were not captured in the index at the time of their actual occurrence but are significant enough to be reflected before the next SAIR. QIRs may result in additions or deletions due to migration to another Size Segment Index, and changes in FIFs and in number of shares. Only additions of significant new investable companies are considered, and only for the Standard Index. The buffer zones used to manage the migration of companies from one segment to another are wider than those used in the SAIR. The style classification is reviewed only for companies that are reassigned to a different size segment.
3. Ongoing event-related changes. Ongoing event-related changes to the indices are the result of mergers, acquisitions, spin-offs, bankruptcies, reorganisations and other similar corporate events. They can also result from capital reorganisations in the form of rights issues, bonus issues, public placements and other similar corporate actions that take place on a continuing basis. These changes generally are reflected in the indices at the time of the event.
The SAIR is carried out once every six months and implemented generally as of the close of the last business day of May and November. The implementation of changes resulting from a QIR generally occurs as of the close of the last business day of February and August. The results of the SAIR and QIR are generally announced at least ten business days in advance of implementation.
Chart 4. The perfomance of indexes from December 1998 till July 2015
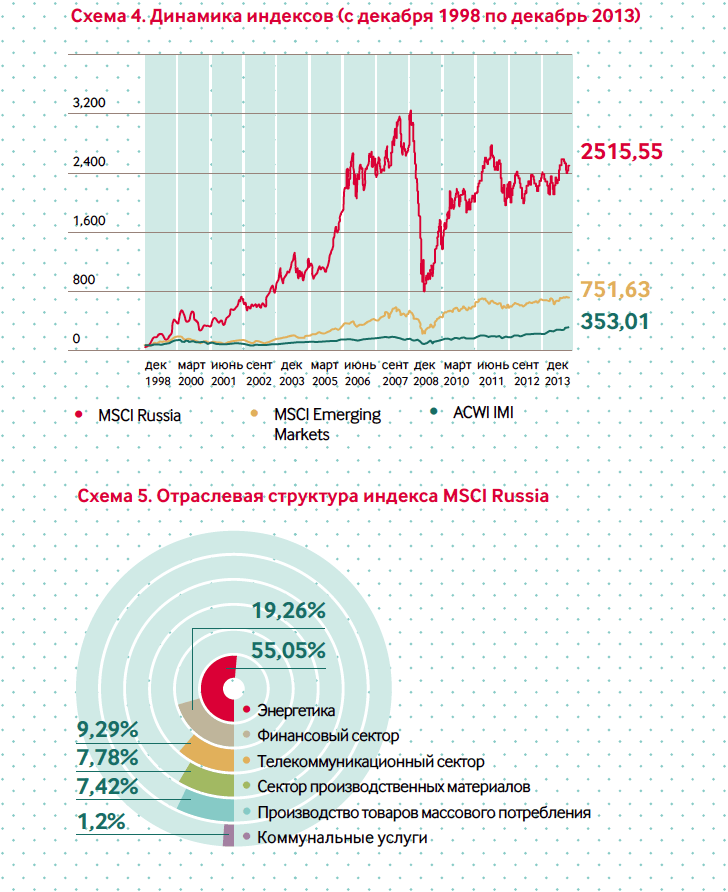
Chart 5. Sector weights as of July 31, 2015

Market Reclassifications. Potential changes in the status of countries (stand-alone, frontier, emerging, developed) follow their own separate timetables. During an Annual Market Classification Review, MSCI analyses and seeks feedback on those markets it has placed under review for potential market reclassification. Every June, MSCI communicates its conclusions from discussions with the investment community on the list of countries under review and announces the new list of countries, if any, under review for potential market reclassification in the upcoming cycle. Ample lead time is provided for implementation of changes in market classification into developed, emerging or frontier status.
6. MSCI Russia Index
The MSCI Russia Index is a free-float adjusted market capitalisation weighted index that is designed to track the equity market performance of large and mid cap Russian securities listed on Moscow Exchange. The MSCI Russia Total Return Index takes into account both price performance and income from dividend payments.
The MSCI Russia Index is constructed based on the MSCI Global Investable Market Indices Methodology, targeting free float market capitalisation coverage of 85%.
The MSCI Russia Index is calculated in USD on a real time basis and disseminated every 15 seconds during market trading hours.
Real time codes:
- Reuters MIRU00000PUS;
- Bloomberg MXRU.
The index is reviewed quarterly – in February, May, August and November – with the objective of reflecting change in the underlying equity markets in a timely manner, while limiting undue index turnover. During the May and November semi-annual index reviews, the index is rebalanced and the large and mid-capitalization cut-off points are recalculated.
MSCI Russia Index constituents as of 31.07.2015
| SECURITY NAME | FIF | FREE FLOAT MARKET CAP (mil USD) | WEIGHT |
|---|---|---|---|
| AFK SISTEMA GDR (USD) | 0.35 | 1,433.75 | 1.03% |
| ALROSA (RUB) | 0.25 | 2,135.88 | 1.53% |
| GAZPROM (RUB) | 0.50 | 27,630.57 | 19.82% |
| LUKOIL HOLDING(RUB) | 0.60 | 21,149.56 | 15.17% |
| MAGNIT GDR (USD) | 0.55 | 14,107.37 | 10.12% |
| MEGAFON GDR (USD) | 0.15 | 1,153.20 | 0.83% |
| MOBILE TELESYS ADR (USD) | 0.50 | 4,236.15 | 3.04% |
| MOSCOW EXCHANGE (RUB) | 0.50 | 1,320.70 | 0.95% |
| NORILSK NICKEL MMC(RUB) | 0.35 | 8,540.51 | 6.13% |
| NOVATEK GDR (USD) | 0.30 | 9,086.15 | 6.52% |
| ROSNEFT (RUB) | 0.11 | 4,512.31 | 3.24% |
| ROSTELECOM COMMON (RUB) | 0.30 | 1,109.46 | 0.80% |
| RUSHYDRO (RUB) | 0.30 | 1,008.67 | 0.72% |
| SBERBANK RUSSIA COM(RUB) | 0.50 | 12,754.15 | 9.15% |
| SEVERSTAL (RUB) | 0.25 | 2,350.84 | 1.69% |
| SURGUTNEFTEGAZ COMN(RUB) | 0.20 | 4,016.09 | 2.88% |
| SURGUTNEFTEGAZ PREF(RUB) | 0.90 | 4,271.56 | 3.06% |
| TATNEFT COMMON (RUB) | 0.65 | 6,964.18 | 5.00% |
| TRANSNEFT PREF (RUB) | 1.00 | 3,551.84 | 2.55% |
| URALKALI COMMON (RUB) | 0.25 | 1,936.51 | 1.39% |
| VTB BANK(RUB) | 0.40 | 6,112.36 | 4.39% |
For more details please visit:
- MSCI Indexes
- MSCI Index Performance
- MSCI Index Licensing
- As of Dec 31, 2014, as reported on March 31, 2015 by eVestment, Morningstar and Bloomberg. The institutional/retail split is based on eVestment and Morningstar database classification. Data excludes futures and options